Observability
Observability in Go Micro spans logs, metrics, and traces. The goal is rapid insight into service behavior with minimal configuration.
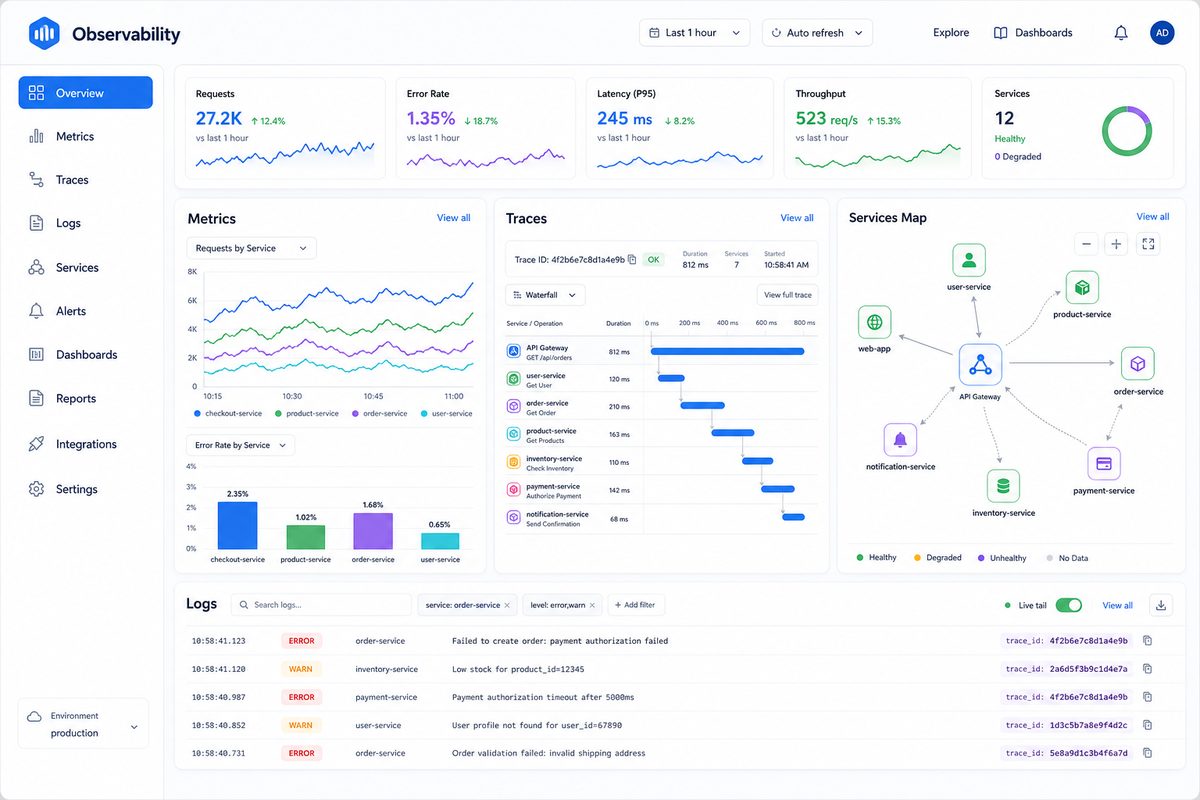
Observability in Go Micro spans logs, metrics, and traces. The goal is rapid insight into service behavior with minimal configuration.
Core Principles
- Structured Logs – Machine-parsable, leveled output
- Metrics – Quantitative trends (counters, gauges, histograms)
- Traces – Request flows across service boundaries
- Correlation – IDs flowing through all three signals
Logging
The default logger can be replaced. Use env vars to adjust level:
MICRO_LOG_LEVEL=debug go run main.go
Recommended fields:
service– service nameversion– release identifiertrace_id– propagated context idspan_id– current operation id
Metrics
Patterns:
- Emit counters for request totals
- Use histograms for latency
- Track error rates per endpoint
Example (pseudo-code):
// Wrap handler to record metrics
func MetricsWrapper(fn micro.HandlerFunc) micro.HandlerFunc {
    return func(ctx context.Context, req micro.Request, rsp interface{}) error {
        start := time.Now()
        err := fn(ctx, req, rsp)
        latency := time.Since(start)
        metrics.Inc("requests_total", req.Endpoint(), errorLabel(err))
        metrics.Observe("request_latency_seconds", latency, req.Endpoint())
        return err
    }
}
Tracing
Distributed tracing links calls across services.
Propagation strategy:
- Extract trace context from incoming headers
- Inject into outgoing RPC calls/broker messages
- Create spans per handler and client call
Local Development Strategy
Start with only structured logs. Add metrics when operating multiple services. Introduce tracing once debugging multi-hop latency or failures.
Roadmap (Planned Enhancements)
- Native OpenTelemetry exporter helpers
- Automatic handler/client wrapping for spans
- Default correlation IDs across broker messages
Deployment Recommendations
| Scale | Suggested Stack |
|---|---|
| Dev | Console logs only |
| Staging | Logs + basic metrics (Prometheus) |
| Prod (basic) | Logs + metrics + sampling traces |
| Prod (complex) | Full tracing + profiling + anomaly detection |
Troubleshooting
| Symptom | Cause | Fix |
|---|---|---|
| Missing trace IDs in logs | Context not propagated | Ensure wrappers add IDs |
| Metrics server empty | Endpoint not scraped | Verify Prometheus config |
| High cardinality metrics | Dynamic labels | Reduce labeled dimensions |
Related
Feedback
Was this page helpful?
Glad to hear it! Please tell us how we can improve.
Sorry to hear that. Please tell us how we can improve.