Observability
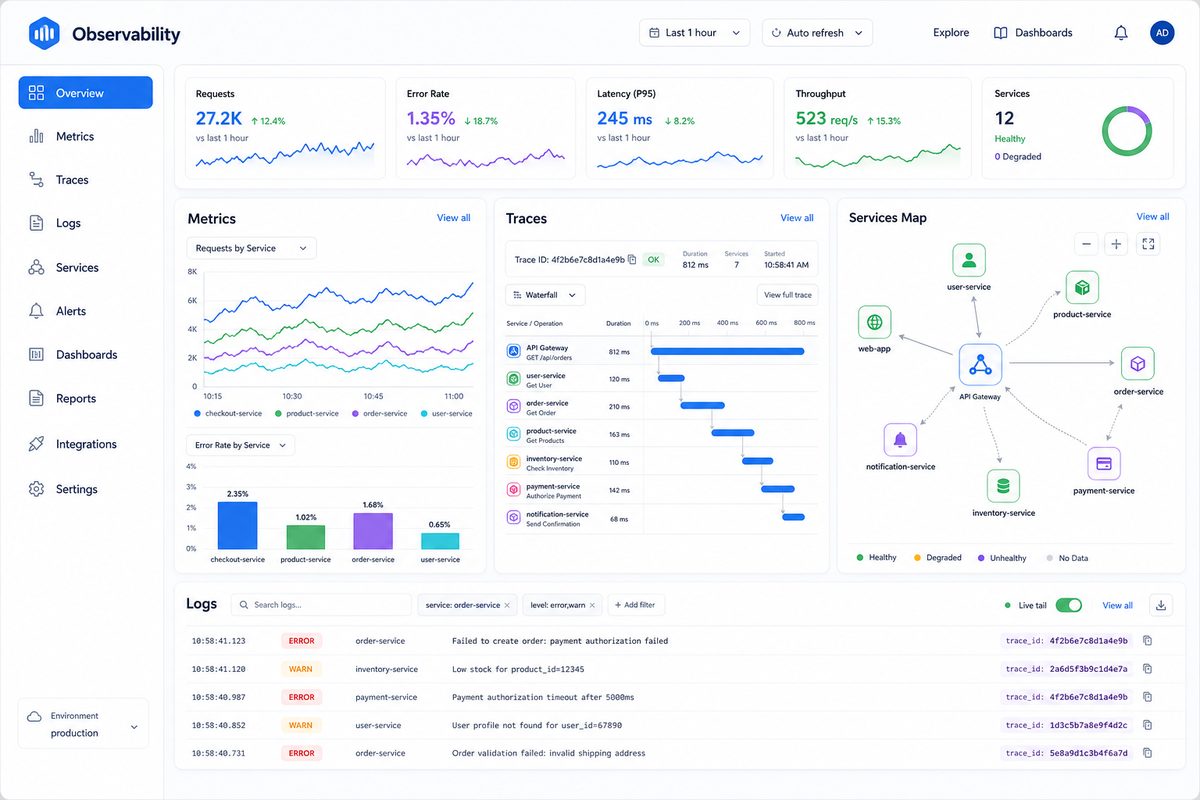
Observability in Go Micro spans logs, metrics, and traces. The goal is rapid insight into service behavior with minimal configuration.
Core Principles
- Structured Logs – Machine-parsable, leveled output
- Metrics – Quantitative trends (counters, gauges, histograms)
- Traces – Request flows across service boundaries
- Correlation – IDs flowing through all three signals
Logging
The default logger can be replaced. Use env vars to adjust level:
MICRO_LOG_LEVEL=debug go run main.go
Recommended fields:
service– service nameversion– release identifiertrace_id– propagated context idspan_id– current operation id
Metrics
Patterns:
- Emit counters for request totals
- Use histograms for latency
- Track error rates per endpoint
Example (pseudo-code):
// Wrap handler to record metrics
func MetricsWrapper(fn micro.HandlerFunc) micro.HandlerFunc {
    return func(ctx context.Context, req micro.Request, rsp interface{}) error {
        start := time.Now()
        err := fn(ctx, req, rsp)
        latency := time.Since(start)
        metrics.Inc("requests_total", req.Endpoint(), errorLabel(err))
        metrics.Observe("request_latency_seconds", latency, req.Endpoint())
        return err
    }
}
Tracing
Distributed tracing links calls across services.
Propagation strategy:
- Extract trace context from incoming headers
- Inject into outgoing RPC calls/broker messages
- Create spans per handler and client call
Local Development Strategy
Start with only structured logs. Add metrics when operating multiple services. Introduce tracing once debugging multi-hop latency or failures.
Roadmap (Planned Enhancements)
- Native OpenTelemetry exporter helpers
- Automatic handler/client wrapping for spans
- Default correlation IDs across broker messages
Deployment Recommendations
| Scale | Suggested Stack |
|---|---|
| Dev | Console logs only |
| Staging | Logs + basic metrics (Prometheus) |
| Prod (basic) | Logs + metrics + sampling traces |
| Prod (complex) | Full tracing + profiling + anomaly detection |
Troubleshooting
| Symptom | Cause | Fix |
|---|---|---|
| Missing trace IDs in logs | Context not propagated | Ensure wrappers add IDs |
| Metrics server empty | Endpoint not scraped | Verify Prometheus config |
| High cardinality metrics | Dynamic labels | Reduce labeled dimensions |